RAAS Blockers and In-Hospital Mortality in ICU Admissions With COPD
1 Executive summary
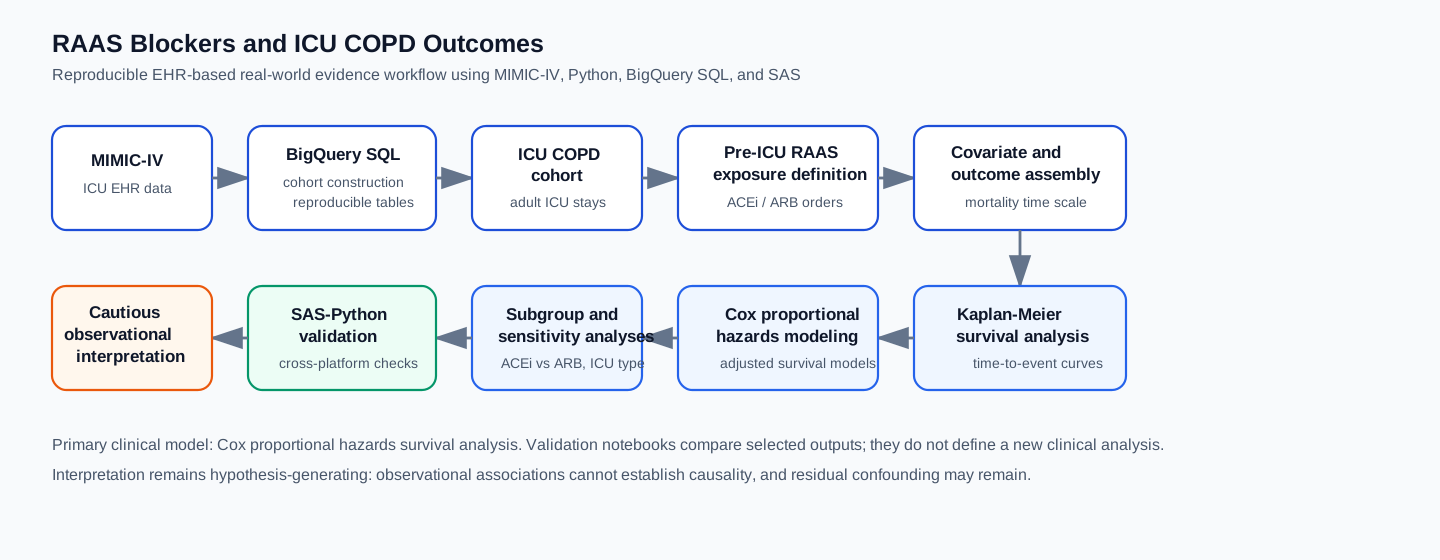
This report presents a polished narrative version of a reproducible MIMIC-IV portfolio analysis evaluating whether pre-ICU renin-angiotensin-aldosterone system (RAAS) inhibitor exposure was associated with time-to-in-hospital mortality among ICU patients with chronic obstructive pulmonary disease (COPD).
The primary analysis used Kaplan-Meier survival curves and Cox proportional hazards models. Pre-ICU RAAS inhibitor exposure was associated with lower observed in-hospital mortality in the Kaplan-Meier and Cox survival analyses. In the refined proportional hazards-compliant Cox model, combined pre-ICU RAAS exposure had an estimated hazard ratio (HR) of 0.717 (95% CI 0.580-0.886; p = 0.00208).
Subclass analyses suggested that ACE inhibitor monotherapy had a stronger observed association than ARB monotherapy. ARB monotherapy was directionally associated with lower hazard but was not statistically significant. Extended covariate and sensitivity models attenuated the RAAS association after additional adjustment, including ICU type and acute severity/case-mix variables.
Overall, the findings should be read as observational associations. Residual confounding, confounding by indication, exposure misclassification, and single-center ICU case mix remain important considerations.
2 Study question
The study question was whether pre-ICU inpatient RAAS inhibitor exposure was associated with time-to-in-hospital mortality among ICU-admitted adults with COPD in MIMIC-IV.
The analysis was designed as a reproducible clinical analytics workflow, not as a causal treatment-effect study. The repository-level study background is available in STUDY_BACKGROUND.md, and the detailed methods outline is available in METHODS_OVERVIEW.md.
3 Data source and cohort
The analysis used MIMIC-IV v3.1, a de-identified ICU electronic health record database maintained by the MIT Laboratory for Computational Physiology and distributed through PhysioNet.
Adult ICU patients with COPD were identified using ICD-9 and ICD-10 diagnosis codes recorded during hospitalization. Each analytic record represented one qualifying hospital admission, anchored to the first ICU stay within that admission; subsequent ICU stays during the same hospital admission were excluded. A patient could contribute more than one qualifying hospital admission. Cohort construction used version-controlled BigQuery SQL and notebook-based checks.
The cohort workflow is documented across the executable notebooks:
| Cohort construction checkpoint | Reader-facing source | Count |
|---|---|---|
| Baseline COPD ICU cohort | Baseline cohort validation | 11,964 |
| Post-merge cohort with RAAS exposure indicators | Post-merge cohort validation | 11,964 |
| Unique hospital admissions in exported extended cohort | Final exported analysis cohort | 11,964 |
| Unique ICU stays in exported extended cohort | Final exported analysis cohort | 11,964 |
| Unique patients in exported extended cohort | Final exported analysis cohort | 9,157 |
| Exposure/outcome summary | Count | Percent |
|---|---|---|
| No pre-ICU RAAS exposure | 11,018 | 92.1 |
| Any pre-ICU RAAS exposure | 946 | 7.9 |
| In-hospital deaths | 1,692 | 14.1 |
| Discharged alive/censored | 10,272 | 85.9 |
3.1 Source Tables To Analysis Dataset
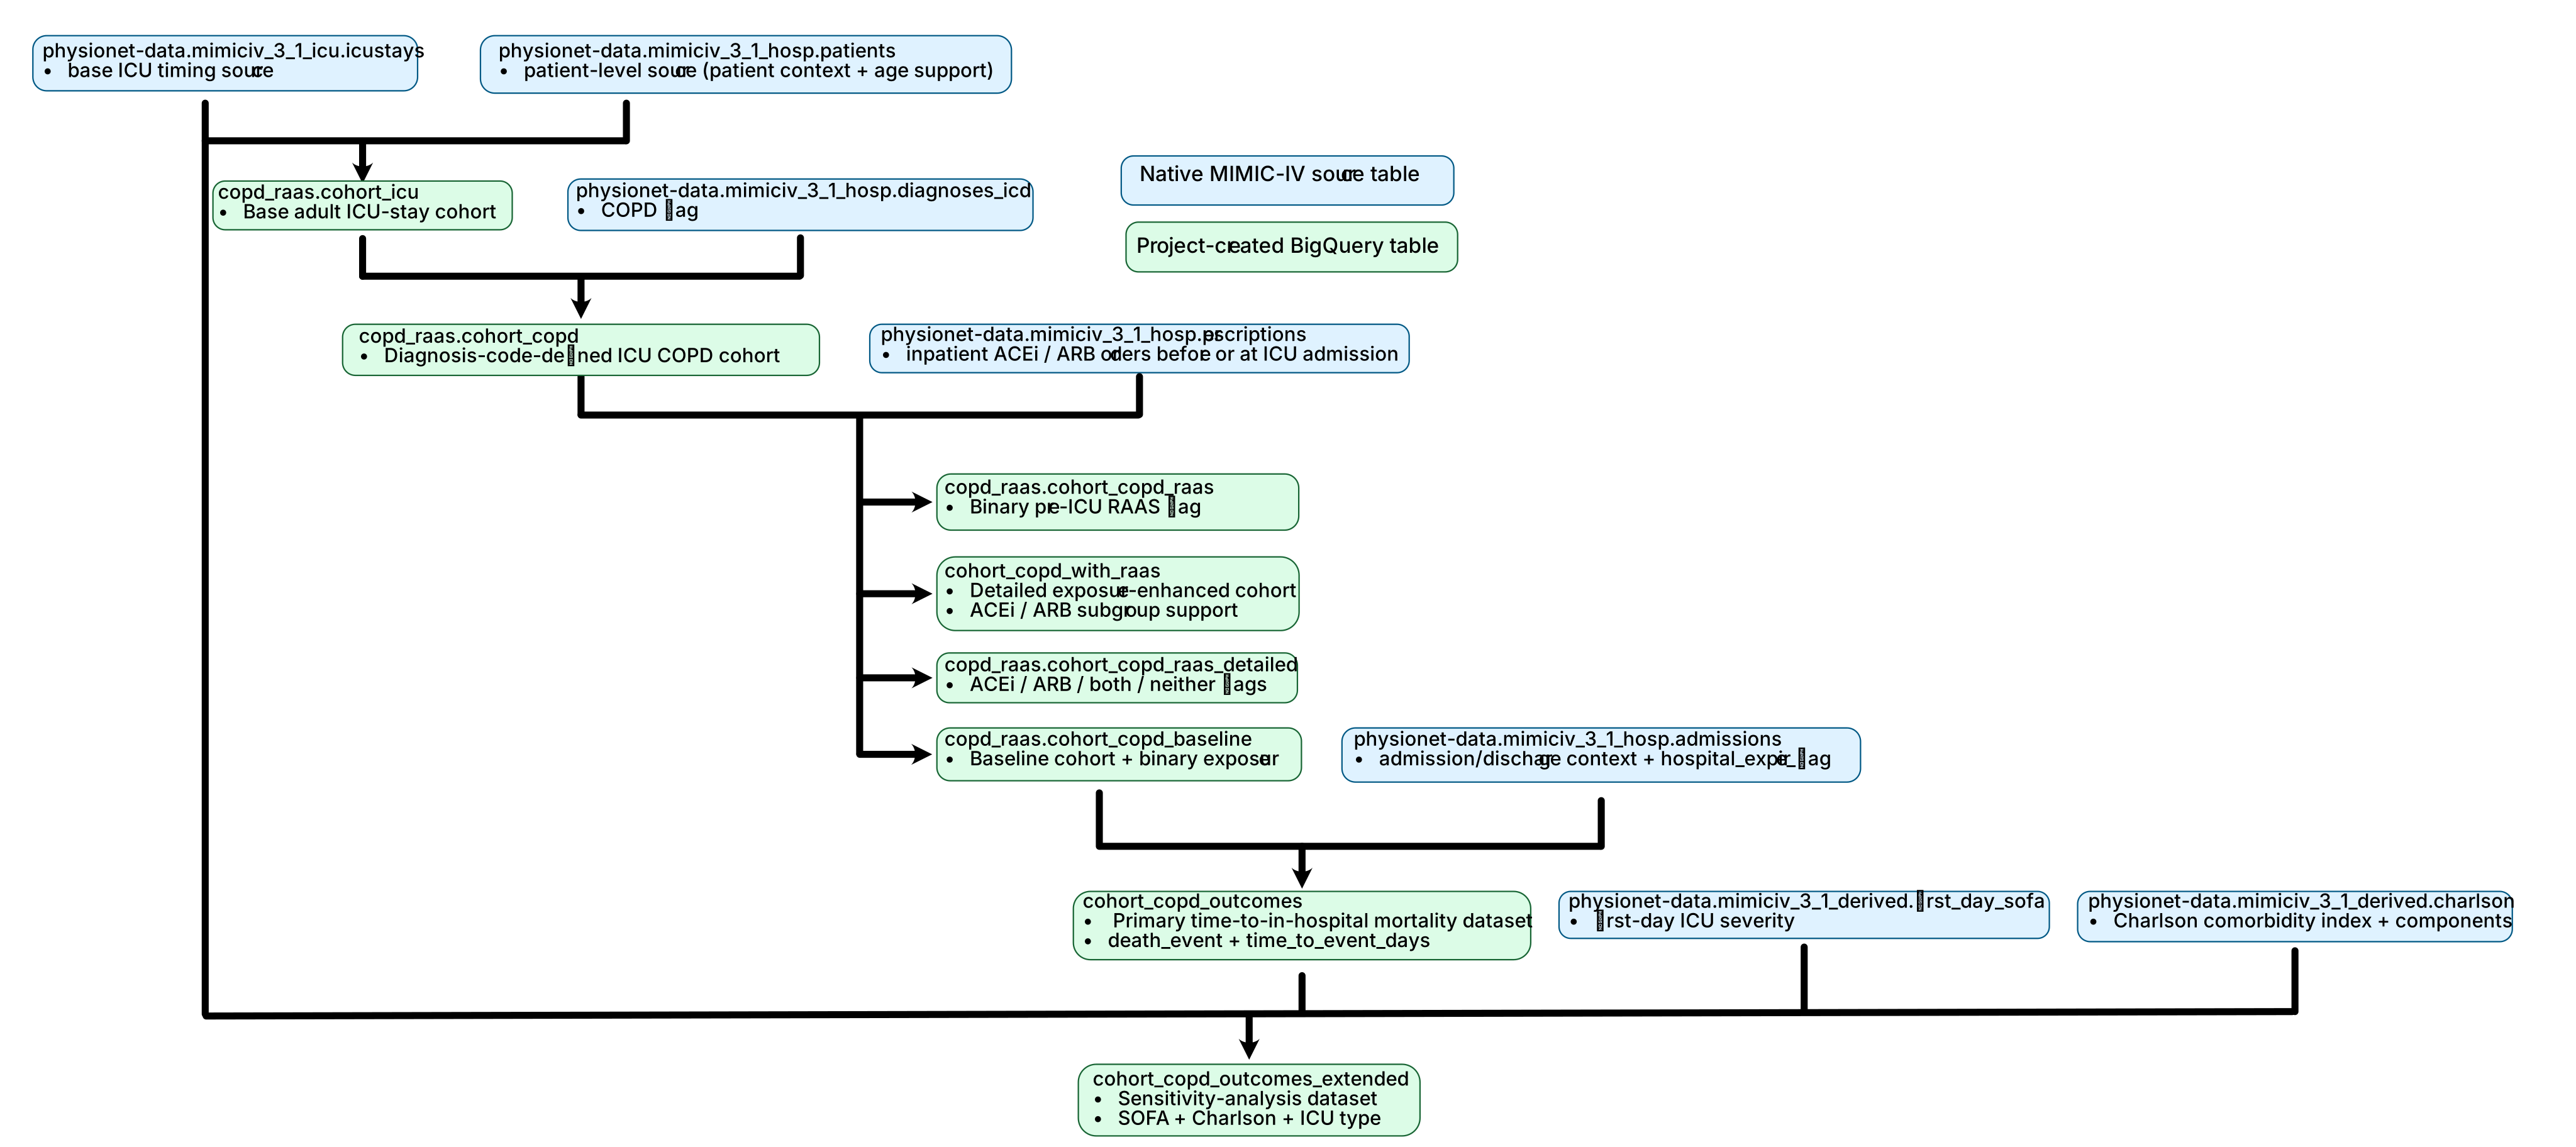
The lineage figure separates MIMIC-IV source and derived tables from project-created analysis tables. Underlying SQL links tables using subject-, admission-, and ICU-stay-level identifiers (subject_id, hadm_id, and stay_id) depending on table level. The primary path builds the ICU COPD cohort, pre-ICU RAAS exposure flag, primary time-to-in-hospital mortality dataset, and extended covariate sensitivity dataset. The figure is schematic: raw MIMIC-IV patient-level data are not included in this repository, and the lineage supports reproducibility and dataset provenance rather than causal interpretation.
4 Exposure, outcome, and covariates
The primary exposure was pre-ICU RAAS inhibitor use, defined from inpatient prescription orders for ACE inhibitors or ARBs before or at ICU admission. This exposure definition supports reproducible EHR-based construction, but it does not directly measure outpatient chronic use, adherence, dose, duration, indication, or medication discontinuation before hospitalization.
Detailed exposure indicators included ACE inhibitor exposure, ARB exposure, dual ACE inhibitor plus ARB exposure, and mutually exclusive ACE inhibitor or ARB monotherapy indicators for subgroup analysis.
The primary outcome was time to in-hospital death, with follow-up beginning at ICU admission. For a death event, time_to_event_days was measured from ICU admission (intime) to the recorded in-hospital death time (admissions.deathtime); discharge time (admissions.dischtime) was used as an explicitly flagged fallback only when death time was unavailable. For a patient discharged alive, follow-up was measured from ICU admission to discharge time and the record was censored at discharge.
Core covariates were selected using a clinical framework and included demographics, cardiovascular comorbidities, chronic kidney disease, diabetes, and SOFA score. Extended sensitivity models added ICU type and additional severity or case-mix variables. The detailed definitions are summarized in METHODS_OVERVIEW.md and the short notebook notes under docs/.
The exported extended cohort supported a compact Table 1-style summary for variables used in the downstream models. Values are descriptive and were not used to introduce additional modeling.
| Characteristic | Overall (N = 11,964) | No RAAS (n = 11,018) | RAAS (n = 946) |
|---|---|---|---|
| Age, median (IQR), years | 70 (61-78) | 69 (61-78) | 70 (63-77) |
| Male sex, n (%) | 6,447 (53.9) | 5,907 (53.6) | 540 (57.1) |
| SOFA score, median (IQR) | 4 (2-6) | 4 (2-7) | 4 (2-6) |
| Charlson comorbidity index, median (IQR) | 6 (5-8) | 6 (5-8) | 7 (5-9) |
| Congestive heart failure, n (%) | 5,505 (46.0) | 4,964 (45.1) | 541 (57.2) |
| Chronic kidney disease, n (%) | 3,321 (27.8) | 3,050 (27.7) | 271 (28.6) |
| Diabetes, n (%) | 4,020 (33.6) | 3,599 (32.7) | 421 (44.5) |
| In-hospital death, n (%) | 1,692 (14.1) | 1,601 (14.5) | 91 (9.6) |
5 Statistical methods
The primary clinical analysis used Kaplan-Meier survival curves and Cox proportional hazards regression. Proportional hazards assumptions were assessed using Schoenfeld residual-based diagnostics. A refined Cox model stratified by calendar-era grouping was used to address proportional hazards concerns while preserving the survival-modeling focus.
Sensitivity analyses evaluated extended covariate adjustment, ICU type, and penalized Cox specifications. A secondary logistic model was fit only for SAS-Python reproducibility comparison; it was not used as the primary clinical analysis.
Live discharge was treated as censoring in the primary Cox analysis. A competing-risk framework was not implemented. The Cox models analyzed admission-level records and did not include a patient-level clustering or frailty term for patients with more than one qualifying admission.
| Cox specification | Schoenfeld p-value for RAAS exposure term |
|---|---|
| Primary Cox | 0.340 |
| Extended core | 0.888 |
| ICU-extended | 0.649 |
These RAAS exposure term diagnostics did not indicate evidence of proportional hazards violation at p > 0.05. Calendar-era non-proportionality identified in the primary modeling workflow was addressed by stratifying baseline hazards by anchor_year_group.
6 Kaplan-Meier survival results
Kaplan-Meier curves showed lower observed in-hospital mortality among patients with pre-ICU RAAS inhibitor exposure compared with those without RAAS exposure. The log-rank comparison yielded \(\chi^2 = 8.22\) and p = 0.00414. The visual separation supported further Cox proportional hazards modeling, while remaining descriptive and observational.
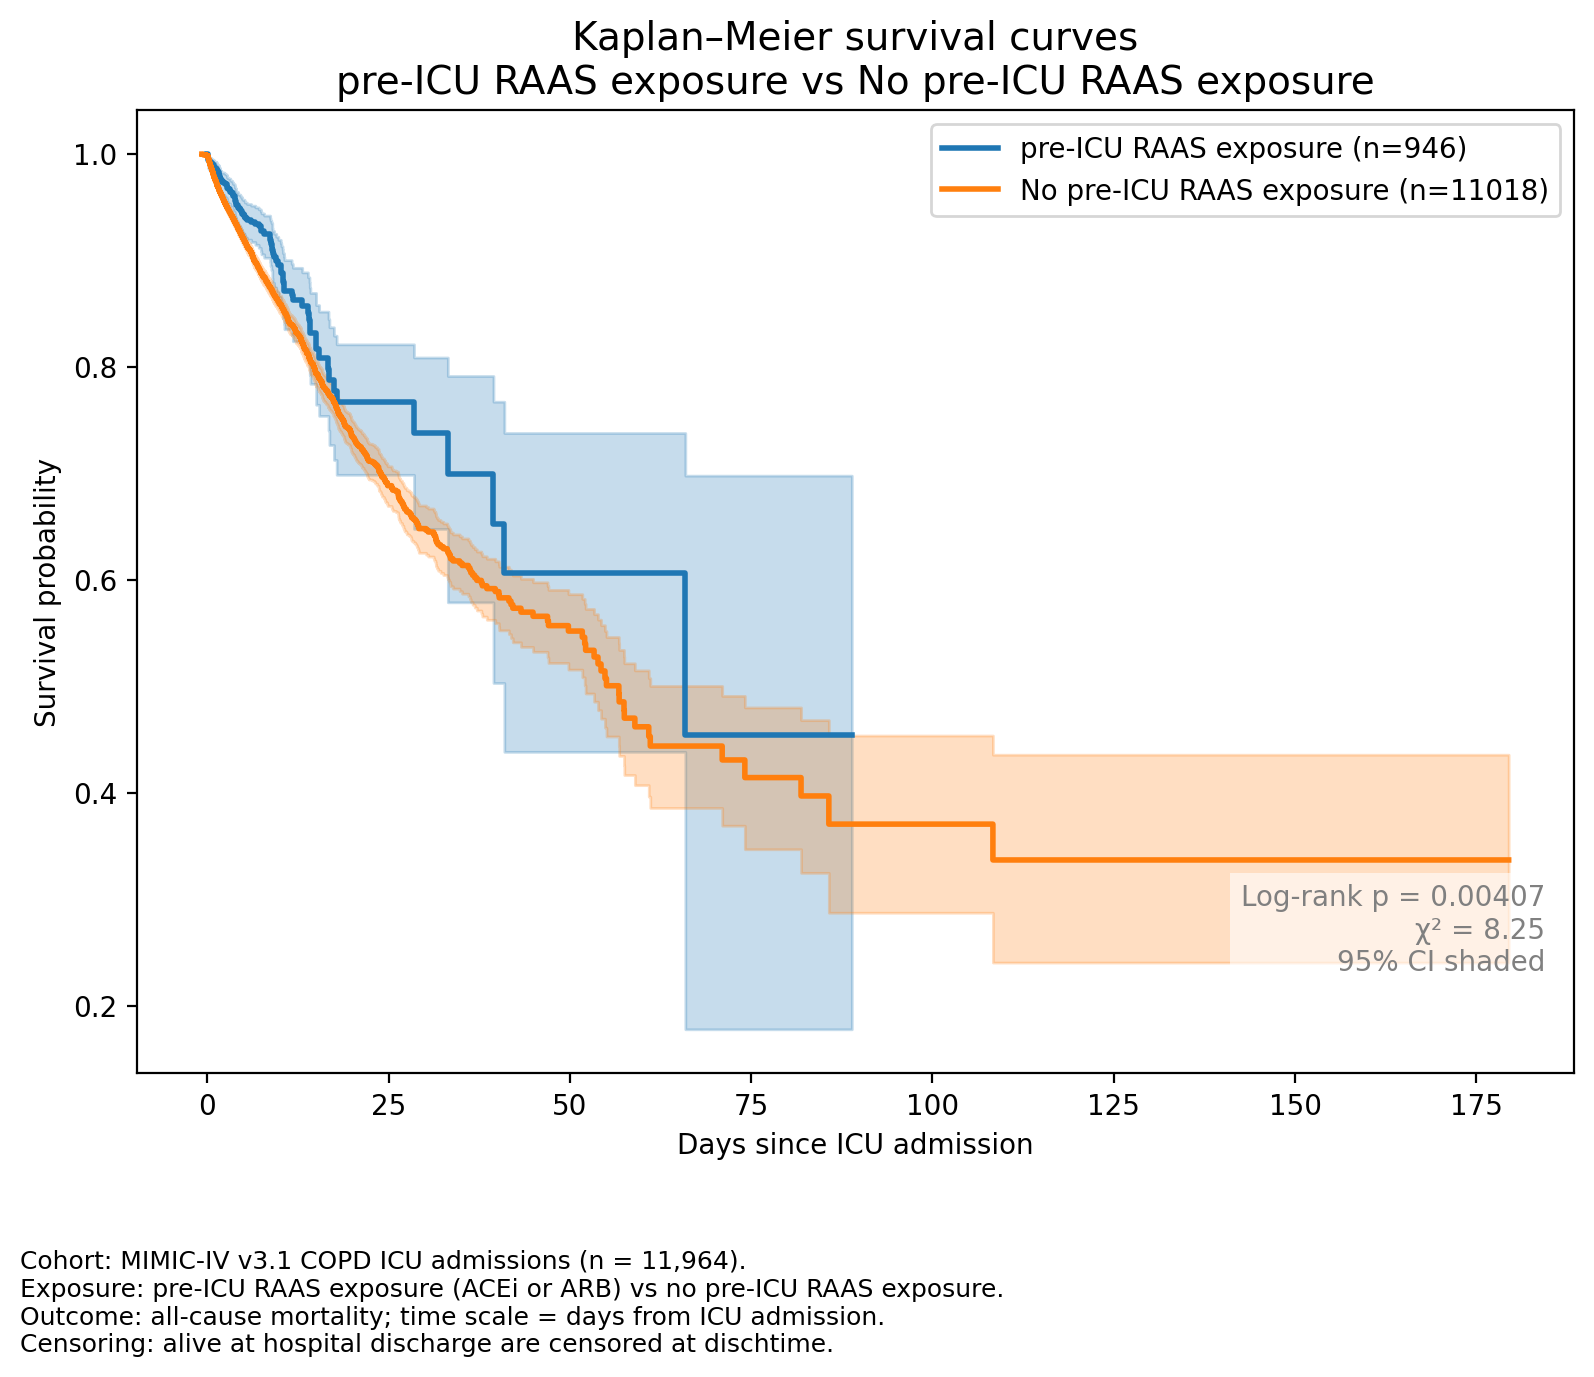
The Kaplan-Meier curves are best viewed as unadjusted survival patterns. They do not account for all differences in comorbidities, acute illness severity, ICU case mix, or medication-prescribing context.
The Kaplan-Meier workflow is available in 04a_outcomes_and_modeling.ipynb, with a concise methods/results note in 04a_outcomes_and_modeling_SHORT.md.
7 Cox proportional hazards results
The refined proportional hazards-compliant Cox model estimated HR 0.717 (95% CI 0.580-0.886; p = 0.00208) for combined pre-ICU RAAS exposure. This indicates that RAAS exposure was associated with lower observed in-hospital mortality hazard after adjustment within the modeled framework.
| Primary Cox model output | Adjustment/structure | RAAS HR (95% CI) | p-value |
|---|---|---|---|
| Initial multivariable Cox model | Age, sex, admission year group | 0.708 (0.573-0.875) | 0.00140 |
| Refined Cox model | Age, sex; baseline hazard stratified by anchor_year_group |
0.717 (0.580-0.886) | 0.00208 |
This estimate is not evidence that RAAS inhibitors caused lower mortality. RAAS exposure may also identify patients with different cardiovascular histories, baseline risk profiles, clinical management patterns, or medication-continuation decisions.
Because the refined primary model was followed by extended covariate and ICU-type sensitivity models, the primary HR should be read alongside the attenuation pattern shown in the sensitivity comparison below rather than as an isolated estimate.
The primary Cox workflow is available in 04a_outcomes_and_modeling.ipynb, with a concise methods/results note in 04a_outcomes_and_modeling_SHORT.md. A project-level interpretation is available in RESULTS_SUMMARY.md.
8 ACE inhibitor vs ARB subgroup analysis
The subclass analysis evaluated whether the observed association for combined RAAS exposure appeared similar for ACE inhibitors and ARBs.
ACE inhibitor monotherapy was associated with lower observed in-hospital mortality in the subclass Cox model (HR 0.663, 95% CI 0.507-0.869; p = 0.00286). ARB monotherapy had a directionally lower-hazard but statistically non-significant estimate (HR 0.800, 95% CI 0.569-1.124; p = 0.19883). The global three-group log-rank comparison yielded \(\chi^2 = 9.14\) with 2 degrees of freedom and p = 0.01036. Dual ACE inhibitor plus ARB therapy was rare and excluded from monotherapy Cox modeling.
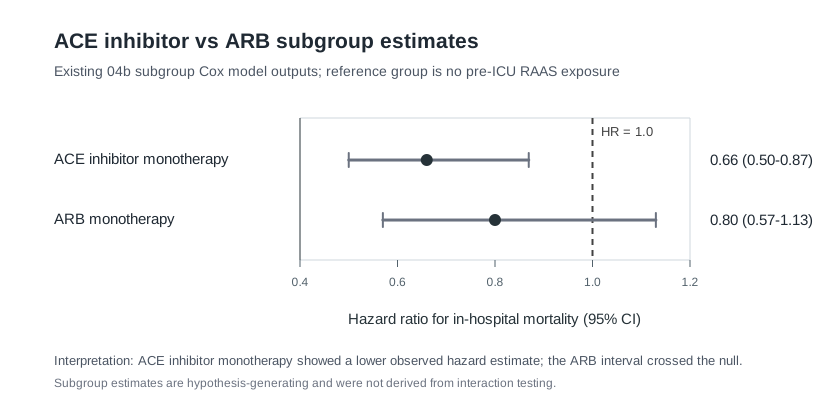
These subclass comparisons are descriptive and hypothesis-generating, and they do not represent a formal interaction test. The observed pattern should not be read as evidence that ACE inhibitors are clinically superior to ARBs in ICU-admitted COPD patients. Confounding by indication, medication-selection bias, contraindications or tolerance, prescribing history, cardiovascular comorbidity, and differences in patient severity may all contribute to the subclass estimates.
The executable subgroup workflow is available in 04b_outcomes_and_modeling_raas_subgroups.ipynb, with a concise note in 04b_outcomes_and_modeling_raas_subgroups_SHORT.md.
9 Extended covariate/sensitivity model interpretation
Extended covariate models evaluated whether the observed RAAS association persisted after adding additional severity, comorbidity, and ICU care-setting variables.
In the unpenalized core Cox model with extended covariates, pre-ICU RAAS exposure had HR 0.809 (95% CI 0.654-1.001; p = 0.05072). This borderline estimate did not meet conventional statistical significance because the confidence interval included 1 and the p-value was greater than 0.05. In the penalized core model, the point estimate remained below 1 but was not statistically significant. After adding ICU type, the RAAS estimate was attenuated and was not statistically significant.
| Sensitivity Cox specification | Additional adjustment/modeling detail | RAAS HR (95% CI) | p-value |
|---|---|---|---|
| Extended core Cox | Severity + comorbidity | 0.809 (0.654-1.001) | 0.05072 |
| Penalized extended core | L2 penalizer = 0.1 | 0.880 (0.761-1.017) | 0.084 |
| ICU-type adjusted | Extended model + ICU type | 0.940 (0.758-1.166) | 0.576 |
| ICU-type adjusted + L2 | ICU type model; penalizer = 0.01 | 0.895 (0.730-1.096) | 0.283 |
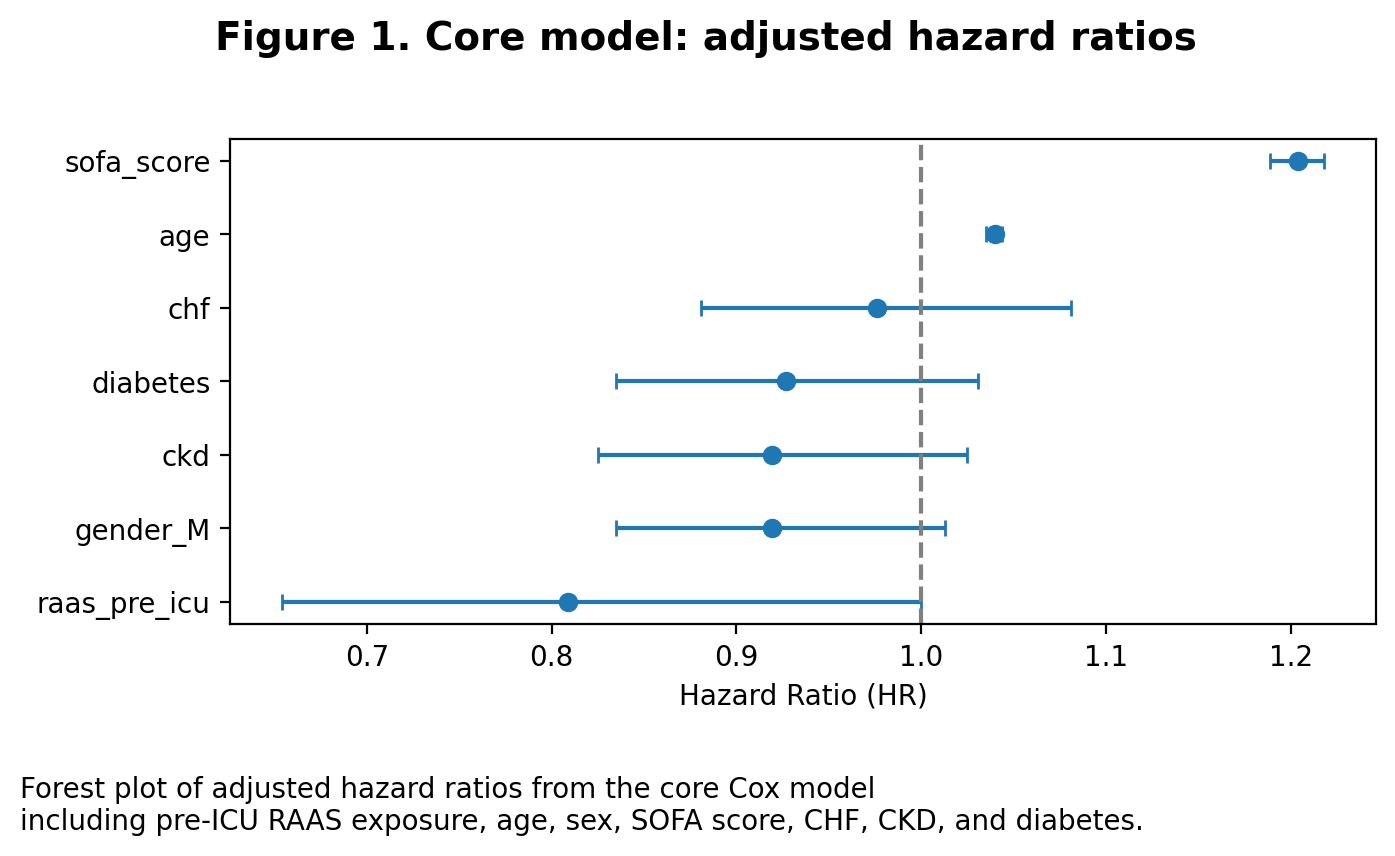
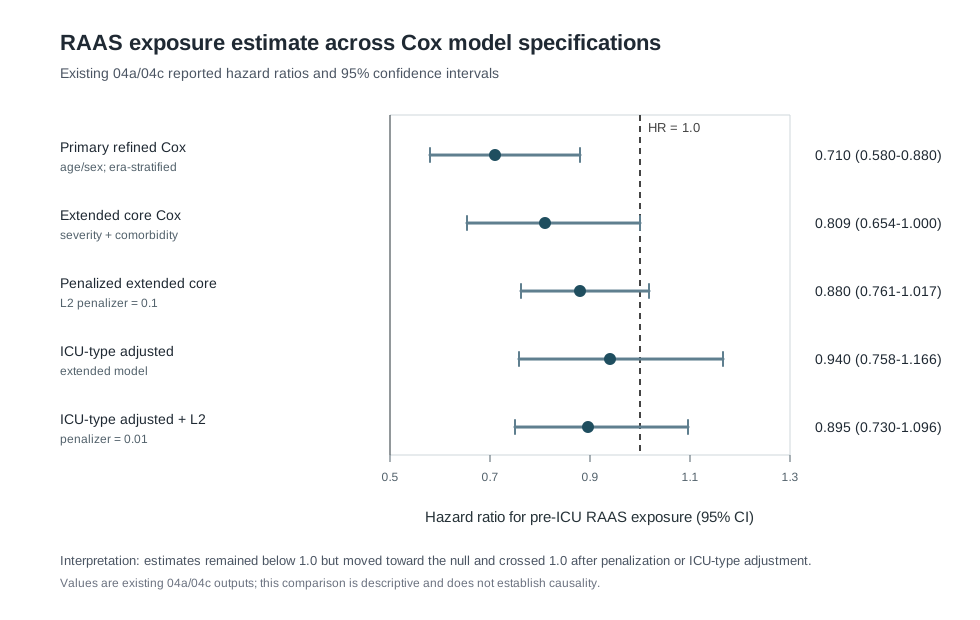
This attenuation suggests that ICU-level case mix, organ dysfunction, and acute clinical severity may contribute to the observed association. In practical terms, pre-ICU RAAS exposure was associated with lower observed mortality in the primary model, but the estimate was sensitive to additional adjustment.
The extended covariate workflow is available in 04c_extended_covariate_cox_model.ipynb, with a concise note in 04c_extended_covariate_cox_model_SHORT.md.
10 SAS-Python reproducibility validation note
The repository includes SAS-Python reproducibility validation for selected secondary model outputs. This step checks cross-platform agreement for exported parameter results and does not introduce a new clinical analysis.
The secondary Python logistic model in 04d_python_logistic_model.ipynb generated parameters for comparison with SAS outputs. The 05_sas_python_validation.ipynb compared precomputed SAS and Python secondary logistic validation outputs. Cox proportional hazards survival modeling remained the primary clinical analysis.
| Validation comparison | Variables compared | Reader-facing source | Result |
|---|---|---|---|
| SAS vs Python secondary logistic parameters | 9 | Cross-platform validation comparison | Absolute estimate differences ranged from 0.000010 to 0.000040 |
| Largest relative estimate difference | 1 variable | Cross-platform validation comparison | 0.171104% for age |
| RAAS exposure estimate comparison | RAAS exposure term | Secondary logistic validation outputs | SAS -0.3153; Python -0.315340 |
Additional details are available in VALIDATION_NOTES.md and sas/README.md.
11 Limitations
The observational design limits causal interpretation. The observed association may reflect residual confounding, confounding by indication, differences in medication continuation or withholding, and unmeasured outpatient care patterns.
The RAAS exposure definition used inpatient prescription orders before or at ICU admission. It does not directly capture outpatient chronic exposure, adherence, dose, duration, patient-level indication, or medication discontinuation before hospitalization.
Live discharge was treated as censoring in the primary Cox analysis. Because discharge may alter the opportunity to observe in-hospital death, this censoring assumption should be considered when interpreting the survival estimates. A competing-risk framework was not implemented.
Each analytic record represented a qualifying hospital admission anchored to its first ICU stay. Patients could contribute more than one qualifying admission, and the Cox models did not account for within-patient correlation with a clustering or frailty term.
COPD status was identified using diagnosis codes recorded during hospitalization. This supports reproducible EHR cohort construction but may introduce misclassification relative to spirometry-confirmed COPD.
MIMIC-IV reflects ICU admissions from a specific health system. Results may not generalize to other hospitals, non-ICU COPD populations, outpatient cohorts, or current prescribing contexts.
The ACE inhibitor versus ARB comparison is particularly exploratory because medication subclasses may reflect different indications, contraindications, tolerability, and comorbidity profiles.
For the full interpretation and limitation discussion, see DISCUSSION_AND_LIMITATIONS.md.
12 Portfolio/reproducibility note
Reproducibility was addressed by separating cohort construction, exposure definition, survival modeling, sensitivity analysis, subgroup analysis, figure generation, and SAS-Python validation into version-controlled workflow steps. The rendered report is supported by notebooks, SQL definitions, aggregate validation outputs, and exported figures, while patient-level MIMIC-IV data remain outside the repository.
For complete environment and reproducibility details, see REPRODUCIBILITY.md.
No patient-level data, credentials, local paths, or large generated intermediate files are included in this repository. Reproduction requires appropriate MIMIC-IV/PhysioNet access, Google Cloud authentication, BigQuery access, and local environment configuration.